Summary of Unity Engine Tool Internship
I have been interning at the Engine Tools position for nearly a year, where I have modified engine source code and have implemented various requirements. Looking back, it has been a long way, and I am grateful for the help of my colleagues in the group and the excellent blogs online (such as Unity Editor editor extension function related and Intel GPA Android Reverse Related. Here is a brief record of the basic content of the engine tool position, which should be a summary and review of resignation. Percept as you travel; Try your very best; Not fear the unknown; Not regret your choice.
Editor tools
The program not only has GamePlay orientation, but also Editor orientation, providing tools for planning art to better output content. In individual development/small teams, it may not be very important (or not at all), but if it is a large-scale project, that is a different story.
Editor classification
It can be roughly divided into two categories: one is to open a single window, and the other is to display it in the Inspector interface
Window editor
The main structure of the window editor is as follows:

1 | using UnityEditor; |
View editor

1 | using UnityEditor; |
Editor Panel
Next is how to organize the various structures in the panel. It is undeniable that Odin is indeed more neat and beautiful now, but Unity’s own Editor is easier to use and modify. The tools I have come into contact with are not as complicated as Player Setting, so I prefer to use Unity’s own Editor.
Object control
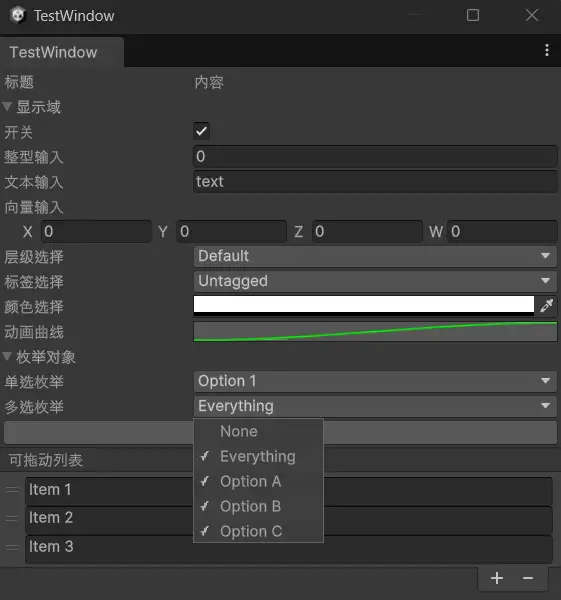
1 | EditorGUILayout.LabelField("标题", "内容"); |
The draggable list needs to introduce UnityEditorInternal (optimize array display) and initialize ReorderableList before drawing
1 | reorderableList = new ReorderableList(listItems, typeof(string));//list's type isReorderableList,item's type is List<string> |
Interface layout

1 | EditorGUILayout.BeginHorizontal();//Horizontal layout |
Message Prompt
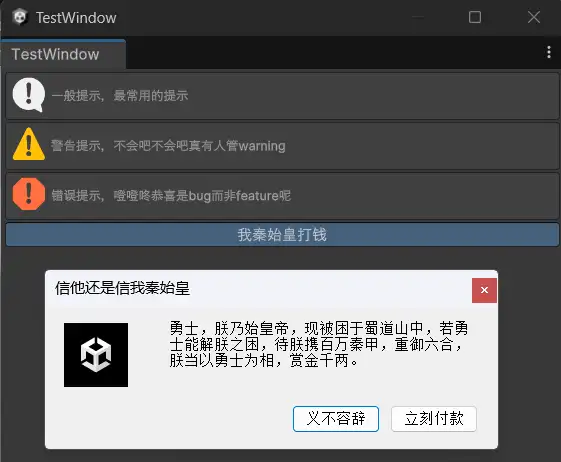
1 | EditorGUILayout.HelpBox("一般提示,最常用的提示", MessageType.Info); |
Odin Editor
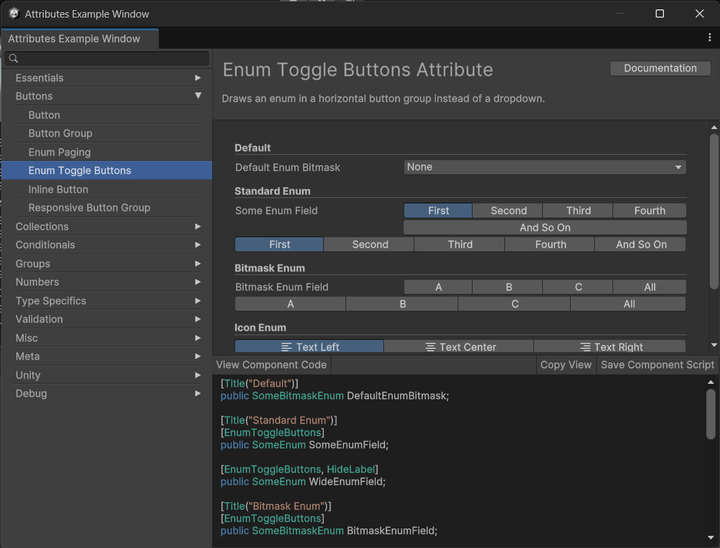
Since I mentioned it before, I will show it briefly again. After all, Odin Editor is for sale, they create Attributes Example Window to show its various features. I don’t think I need to elaborate on it.
Visual Editor
This is the demand for a dialogue editor that I encountered when I was doing my graduation project after resigning. However, I was developing it alone at that time, so I chose to write it in CSV for efficiency. Later, I started to learn about it, made a dialogue editor, and incorporated the content of the visual editor into this article. Currently, the more famous open source node editors are XNode and NodeGraphProcessor. I personally like the interface of XNode, and finally chose to use it to implement the dialogue editor. The picture below is a phased result, and the content is selected from a passage in “The Glowing Canvas on the Color of Timidity”.
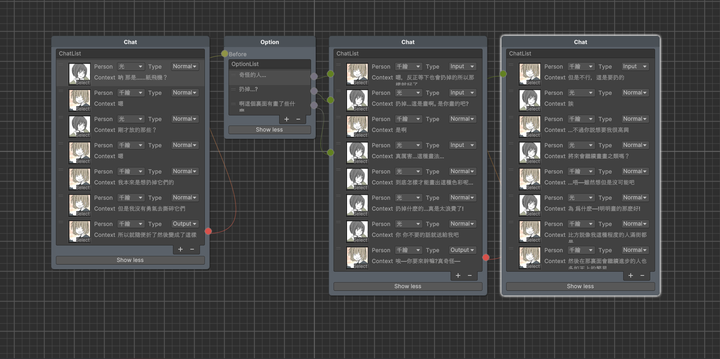
XNode is divided into Graph (the entire visual graph), Node (customized node) and Port (port for connecting nodes). To create a custom visual editor, you need a Graph script (to create the corresponding graph), a Node script (to define the content of the node), and a NodeEditor script (optional, to define how the elements in the node are drawn in the graph). You can fully connect to Odin and let it control it, or you can use Unity for serialization and call the GUI for drawing. I personally choose the latter (poor with no money to buy odin.jpg).
Editor file operations
It should be noted that modifying the Prefab file directly under Load cannot be saved back, and it must be instantiated before making the modifications and saving.
1 | AssetDatabase.CopyAsset(OldPath, NewPath) //Copy file |
Frame truncation, performance analysis, and reverse engineering
Frame truncation
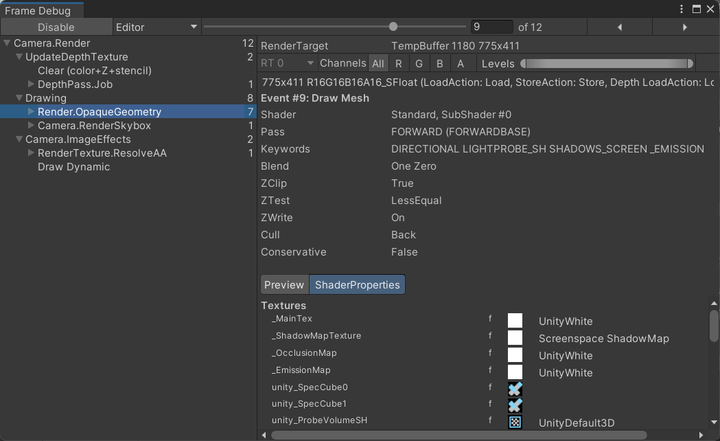
Frame Debug
Convenient and fast, you can view the rendering order, shaders used for rendering, and texture related information, which can help quickly locate problems
RenderDoc
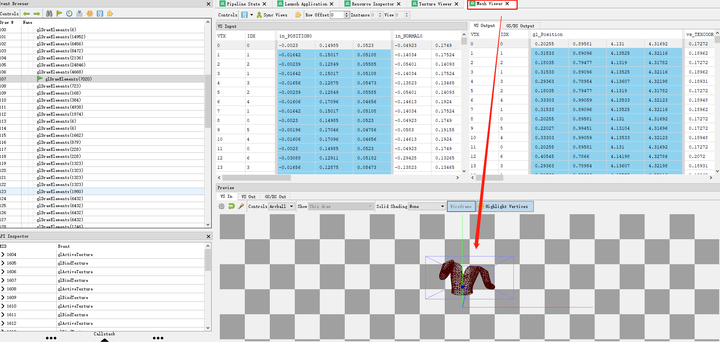
You can view vertex data, shader code, and modify preview effects. When encountering tricky rendering problems, you can give it a try.
Performance analysis
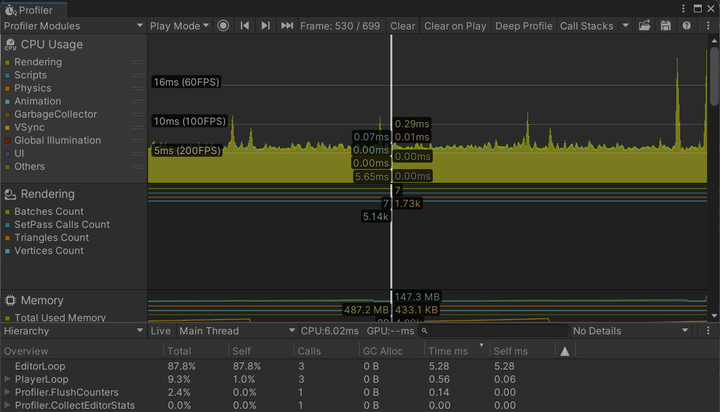
You can analyze the overhead of various functions in Unity through the built-in Profiler, and you can also use code to enable logging to understand the performance of new functional modules (further, you can try the Profile Analyzer)
Reverse engineering
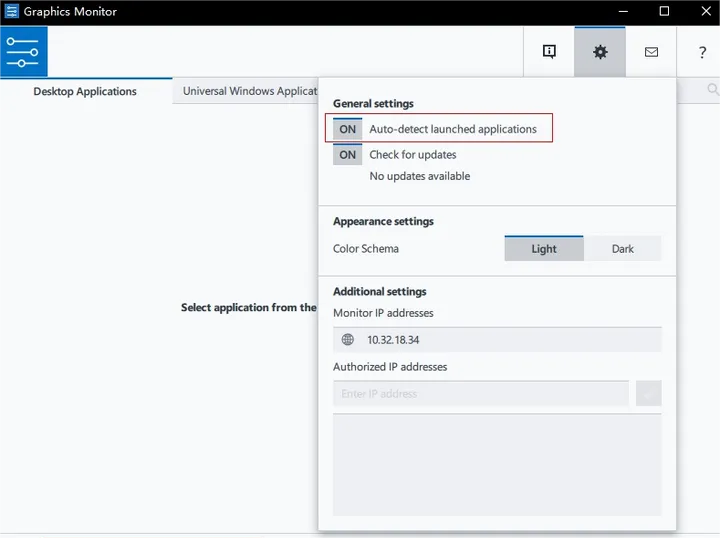
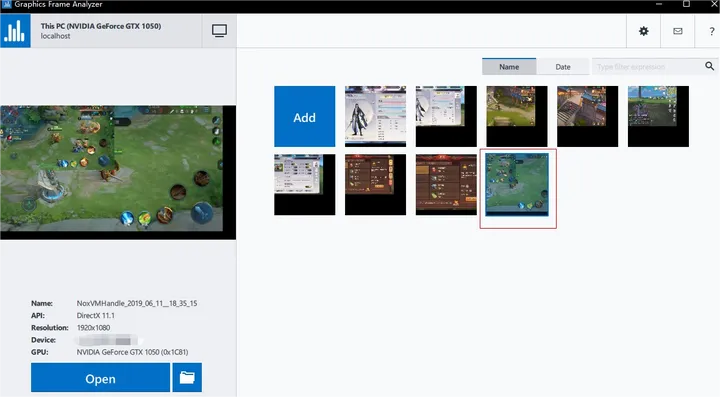
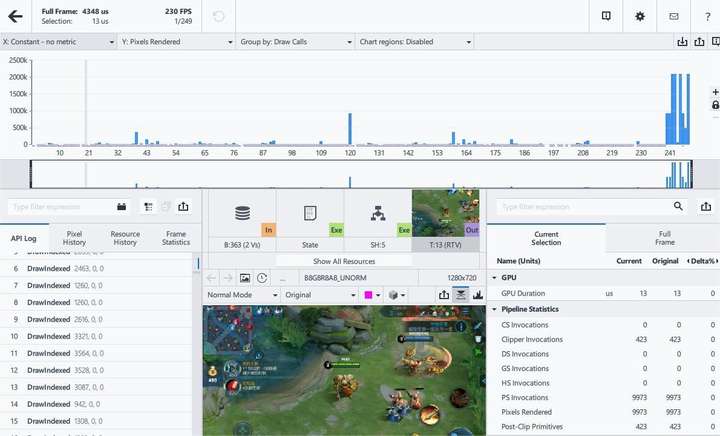
By using Intel GPA you can reverse engineer emulators on a computer. First, open the Auto detect Launched Applications in Graphics Monitor, then run the game, take screenshots of the desired scene, and finally load relevant screenshots in Graphics Frame Analyzer to obtain model resource information.
